Guides
Find your best time to post from your own link click data
Industry studies on the best time to post disagree because they measure other people's audiences. Your short links record when your own audience clicks. How to read that data by day and hour.
Updated
Published "best time to post" studies measure engagement across millions of accounts that aren't yours, and they regularly contradict each other. Your audience has its own habits. Every click on a short link is stored with its exact time, so a few weeks of links tell you when the people you reach actually act.
This measures clicks, not likes or views. If your goal is traffic to a page, that's the number you care about.
Collect enough data first
- Use a short link in every post, Story, newsletter or message you want to include, with one link per post. See Social media link tracking.
- Post at different times on purpose for a few weeks. If you always post at 9:00, the data can only tell you that people click after 9:00.
- Aim for a few hundred clicks before drawing conclusions. A handful of clicks per hour is mostly noise.
Look at days in Analytics
Open Analytics, choose Last 30d, and switch Clicks Over Time to the bar chart with Labels turned on. Each bar is one day, so weekly patterns show up quickly: a dip every Saturday, or a spike every Tuesday when the newsletter goes out.
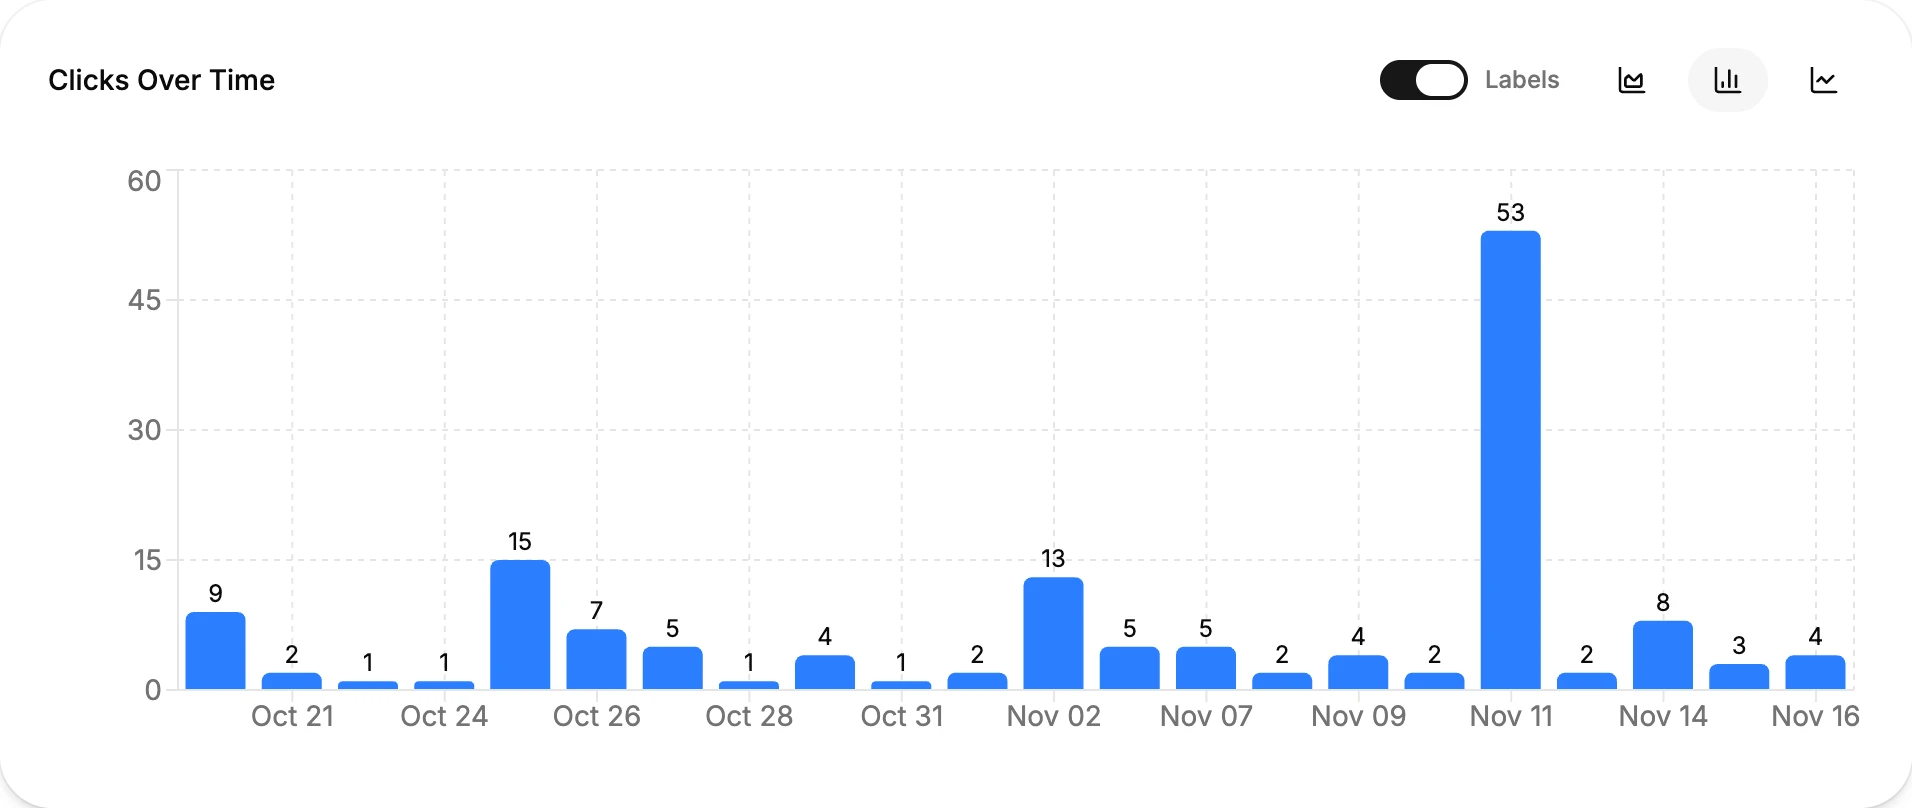
Filter to one channel by opening the analytics of a single link, or by grouping links into a project and looking at the project's clicks.
The chart counts days in UTC. If your audience is far from UTC, a day in the chart can include the evening of the day before. For an hour-by-hour view in your own time zone, use the click log.
Look at hours with the click log
Reports lists every click with its time. On paid plans, click Export CSV to download the last 30 days of clicks and count them by weekday and hour in a spreadsheet, or use the API script below to do it for you in your audience's time zone.
This Python script pages through GET /v1/reports, keeps clicks on the links you name, and prints a table of clicks per weekday and hour. Set SHORTENER_API_KEY to an API key, and change LINKS and TIMEZONE:
import os
from collections import Counter
from datetime import datetime
from zoneinfo import ZoneInfo

import requests

API = "https://api.shortener.dev/v1/reports"
HEADERS = {"Authorization": f"Bearer {os.environ['SHORTENER_API_KEY']}"}
LINKS = {"ig-bio", "li-post-launch", "nov-news-button"}  # back-halves to include, empty for all
TIMEZONE = ZoneInfo("Europe/London")

counts = Counter()
offset = 0
while True:
    page = requests.get(API, headers=HEADERS, params={"offset": offset, "limit": 1000})
    page.raise_for_status()
    data = page.json()
    for click in data["result"]:
        key = click["url"].rsplit("/", 1)[-1]
        if LINKS and key not in LINKS:
            continue
        local = datetime.fromisoformat(click["timestamp"].replace("Z", "+00:00")).astimezone(TIMEZONE)
        counts[(local.strftime("%a"), local.hour)] += 1
    offset += data["returned"]
    if data["returned"] == 0 or offset >= data["total"]:
        break

days = ["Mon", "Tue", "Wed", "Thu", "Fri", "Sat", "Sun"]
print("hour " + " ".join(f"{d:>4}" for d in days))
for hour in range(24):
    print(f"{hour:>4} " + " ".join(f"{counts[(d, hour)]:>4}" for d in days))
The output is a 24 by 7 grid. Paste it into a spreadsheet and add color scaling to see the busy hours at a glance.
Separate the post from the reaction
Clicks cluster right after you post, whatever time that is. A table built from posts that all went out at 9:00 shows a 9:00 peak because that's when you posted, not because 9:00 is best. Two ways to correct for it:
- Compare posts made at different times. For each post, total its clicks in the first 24 hours, then compare posts made in the morning with posts made in the evening.
- Look at links that are always on. Your bio link, a link in your email signature or a QR code on your shop window gets clicks whenever people choose to look. Their hourly pattern shows when your audience is active, without the effect of your posting time.
Read it by channel
Audiences behave differently in each place. LinkedIn clicks tend to follow working hours, while Instagram and WhatsApp clicks often peak in the evening. Run the script for each channel's links separately rather than mixing them.
Check the Countries report too. If a large share of clicks comes from another time zone, look at that country's clicks separately, or schedule a second post for them.
Frequently asked questions
What time zone does Shortener.dev use for clicks?
Click times are stored in UTC. The script above converts them to the time zone you choose.
How much data do I need?
Enough clicks that each hour you care about has more than a few. A few hundred clicks spread over three or four weeks is a reasonable start for a single channel.
Can I see clicks by hour in the dashboard?
Clicks Over Time shows clicks per day. Each click in Reports has its exact time. Export them with Export CSV, or use the script above to group them by hour.